What's It Worth?
Tracking Vintage Baseball Card Values
By George Vrechek
Vintage baseball cards have been a great investment. Vintage baseball cards have been a lousy investment. Both statements are true – it all depends what cards and what periods you examine.
Prices for stocks, prices for cards
Those who have been in the hobby for the long haul have seen prices escalate, cool, drop and creep back up. The stock market has experienced similar swings over the years. Conventional wisdom has been that in owning stocks you will experience the risk of market fluctuations, but just hang in there, and you’ll do better than stuffing money in your mattress.
It is tempting to think the same way about baseball cards. Not many of us buy cards with the idea that we are going to provide a retirement nest egg. However, we like to feel that we bought at a good price, values will go up and what we had to pay for the last card to complete the set was a good investment, even if it seemed pricey.
Holding for the long term
Some of the stock market analyses I’ve seen show, if you owned stocks in 1929 or even 1840, you would be in good shape financially today, if not physically. But what if you don’t have 80-plus years to invest and are only in the market for a lousy 10 years? The last 10 years have had pretty tepid results for the stock market.
Baseball card prices seem to have similar financial results. However, if you owned all the vintage cards you ever wanted in the 1970s and held them, you would have a decent financial return today, as well as the continued joy of flipping through cardboard instead of stock certificates. Even if you had hoarded Mickey McDermott instead of Mickey Mantle cards, you would have had good financial results. A rising tide lifts all boats.
But what if you didn’t happen to be around in the 1970s, you got back into the hobby in later years, or you’ve been buying cards to complete sets for many years? How have the prices of vintage baseball cards behaved? I thought I’d take a look at the numbers.
Developing a vintage card index
For financial analyses, you can use indices such as Standard & Poor’s 500 Index (S&P 500) and the Consumer Price Index (CPI). We don’t have a vintage card index, but I thought it would be handy, at least for this article, if I cooked one up.
There are plenty of arguable assumptions in conventional financial indices and the Vrechek Vintage Card Index (VVCI) will join the club of indices with arguable assumptions. While we could look at prices for individual cards, I felt that set prices would give a weighted average performance. Although we don’t all buy Near Mint cards, prices of cards in other conditions generally move with the Near Mint prices. I decided to find the Near Mint prices for popular vintage sets.
I didn’t have price guides for each of the last 31 years, but I had several of them. I felt that I could pick price guide values at certain key times in the card market and draw conclusions without looking at values of every card, every year. I decided to start looking at prices in 1981 for popular sets issued prior to 1981.
The next requirement was to find price guides that would give comparable information. SCD has a vintage baseball card catalog, but it didn’t go back to 1981. Beckett and Eckes “Beckett” started in the late 1970s with the Sport Americana Baseball Price Guide. I decided to use Beckett for the early years and SCD for the later years. The high grade in the old Becketts were listed as “Mint’ whereas SCD’s top grade was generally “Near Mint.” While there is a big financial distinction in graded cards between Mint and Near Mint, I felt that when people talked about “Mint” in the early 1980s, they were just as happy if the cards were really “Near Mint.” Therefore, I used the top condition in all the catalogs, regardless of what they were called at the time. I did not consider any added value for a card being graded by a third party.
While the price guides are nicely printed and look real, the catalog prices are not exactly like the price you get when you go to sell your S&P 500 mutual fund shares. With stocks, you can sell them at any time and can get a market price before you sell. What you eventually get for your cards can vary all over the map.
Grade inflation
While only a fraction of collected cards are in Near Mint or Mint condition, the prices for lower condition cards generally move as a percentage of the Mint price. However that percentage has been drifting downward. In 1981, Beckett showed three columns: Mint, VG-EX and F-G. The prices for VG-EX 1952 Topps commons were 77 percent of the Mint price.
In the 2012 SCD guide, the columns are Near Mint, Excellent and Very Good. If you calculate a price for a VG-EX 1952 Topps common (half-way between the prices for Excellent and Very Good cards) it is only 40 percent of the Near Mint price.
The change in the discount from Mint is most noticeable in the early 1980s. By 1985, the percentage for VG-EX cards was about 50 percent of Mint versus 77 percent in 1981. By 1992 it was 45 percent, and got to about 40 percent by 2001. Therefore, the returns for lower condition cards would be significantly worse than the VVCI (for the early 1980s and slightly worse thereafter).
Assumptions in the VVCI
While it is nice to know that a card might be purchased for the value shown in a guide (assume $50), it is naïve to think you can turn around and sell the card for the same price the next day. You either take it to a dealer who will give you something less than book value or you can advertise it, auction it or sell it at a card show. In any event, you will have some cost (or reduced price) to sell the item. It might be 50 percent of what you just paid or 2 percent, but it is going to be something. When you hold a card 30 years and sell it for five times what you paid, a commission doesn’t seem too bad. However, it reduces your return, and the shorter the holding period, the greater the reduction in your return. I used 10 percent as a minimum cost to sell in my analyses. If you assume a greater cost, the returns obviously go down. Taxes have not been considered.
If you feel that you never pay full book price for anything, you might also agree that people, including you, never will sell for full book value either. With this logic, any discount in buying prices is offset by a similar discount when selling. The absolute numbers go down, but the percentage returns remain the same. My assumptions include the notion that you could actually sell cards for the price guide values (minus a cost to sell), not a very rock-hard likelihood.
Finally, the S&P 500 is weighted for the relative values of the largest corporations. The VVCI is not. I didn’t add up the values of all the sets in an era to track their total value. I tracked the performance of individual sets and then weighted their percentage returns equally, giving the performance of 1959 Topps the same weight as 1952 Topps. I thought this result would be representative of the experiences of collectors working on sets over several eras.
Overall observations
When the dust settled on the number-crunching, I made several observations for the period 1981-2012:
- The S&P 500 has enjoyed an average annual return of 8 percent since 1981, but much of that is due to robust returns until 2001 and not much return thereafter.
- The CPI has chunked along at an average annual rate of 3.3 percent.
- The Vrechek Vintage Card Index (VVCI) shows an average annual return of 8.6 percent, but that performance consists of whopping returns (like 20-60 percent per year) until the early 1990s, and bumpy returns since.
- The VVCI may have been a leading indicator for future S&P averages in that card prices tanked many years before the stock market tanked.
- Even if you assume a 50 percent cost to sell, vintage cards held for the long haul have done better than inflation, if not the stock market.
1950s Topps cards
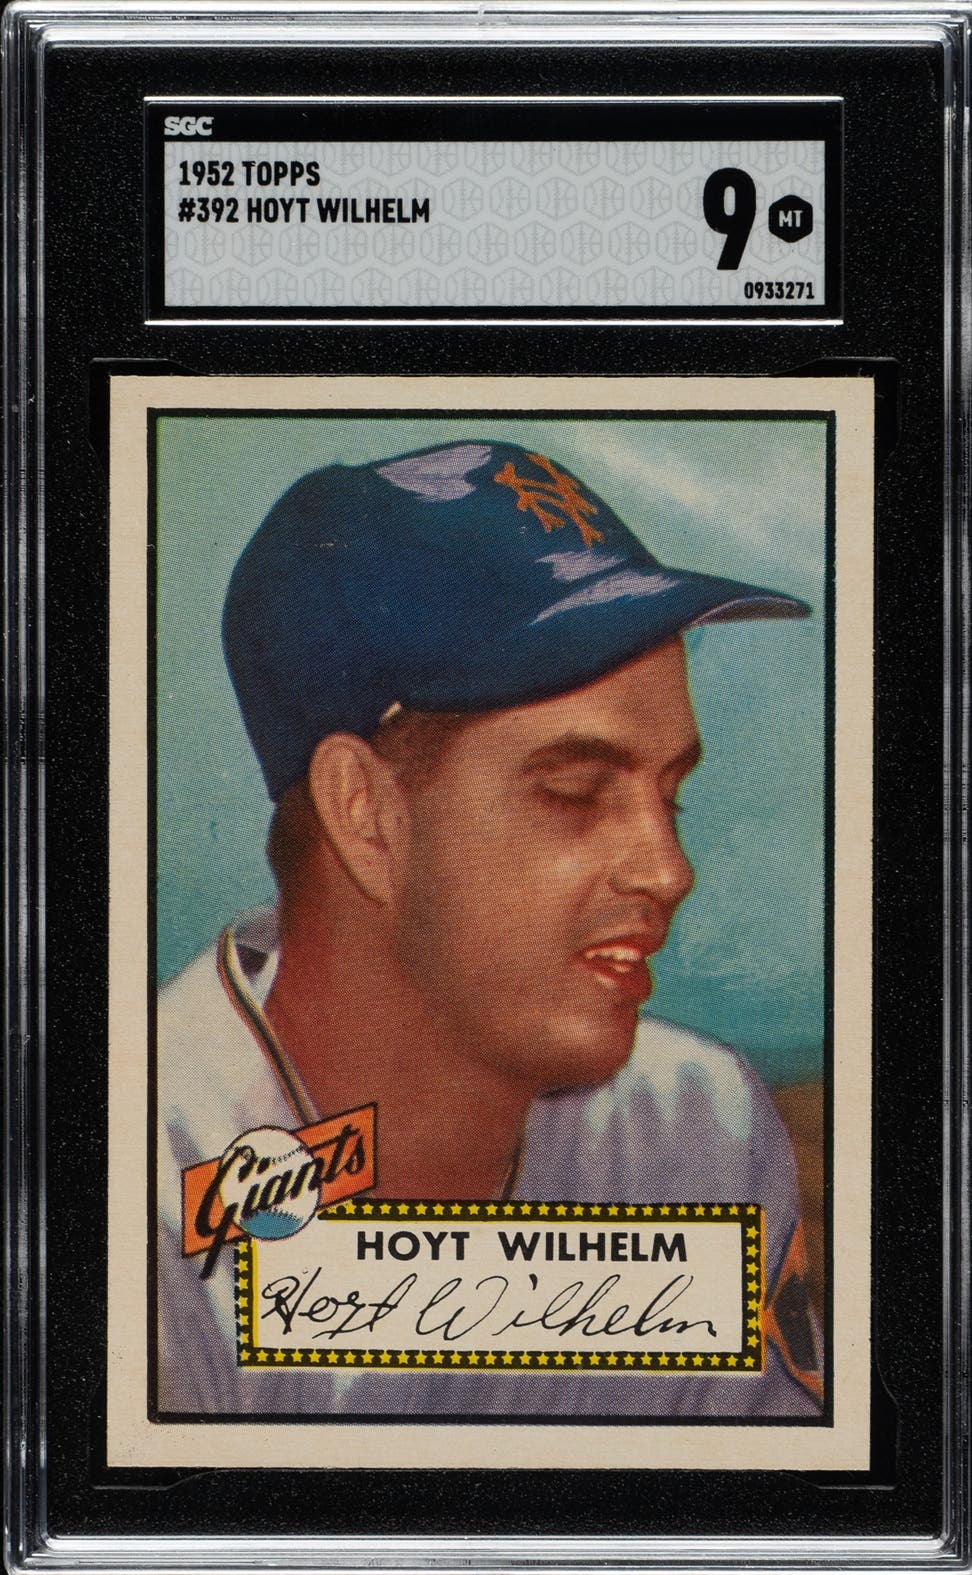
The prices of 1950s Topps sets have shown an average annual return of 9.7 percent for the 31 years since 1981. That sounds like a wonderful, steady return until you look at the roller coaster details. Topps sets from the 1950s didn’t show much of an increase at all between 1981-85, at least according to the Beckett guides. If you bought all the 1950s Topps sets in Near Mint in 1981 and sold them in 1985, the returns were almost nothing after you factor in my 10 percent cost to sell assumption. The relatively affordable 1956 set had the best return at 4.5 percent (all returns shown are compounded annual returns for the period involved, e.g. 1981-85) while the popular 1952 set had a 1 percent negative return.
The change from 1985-89 was incredible, with nearly every ’50s Topps set returning 60 percent per year. The value of a typical set increased five-fold. This may have been a case of the 1985 prices being too conservative and the 1989 prices being too optimistic, but the values shown were based on surveys seeking the truth.
The truth seemed to be that prices were going through the roof, but who knew how long they would last. Just like with the stock market, if you sat on the sidelines during this brief era, you missed a good deal of the action, which accounted for much of the long-term return.
From 1989-92 set prices continued to increase at a more modest rate of 15 percent per year. Prices went up around $2,000 per set (much more for 1952), but the ice was getting thin. The housing market in the last 10 years provides an example of prices initially freezing at the top of the market with sellers unwilling to take losses and no sales occurring until reality sets in and prices drop. This era of card price increases did not continue. Prices for ’50s Topps sets declined 2 percent per year or 15 percent in total over the 10 years ending in 2001. Since 2001, prices have bounced back at a nice rate of 7 percent per year.
1960s Topps sets
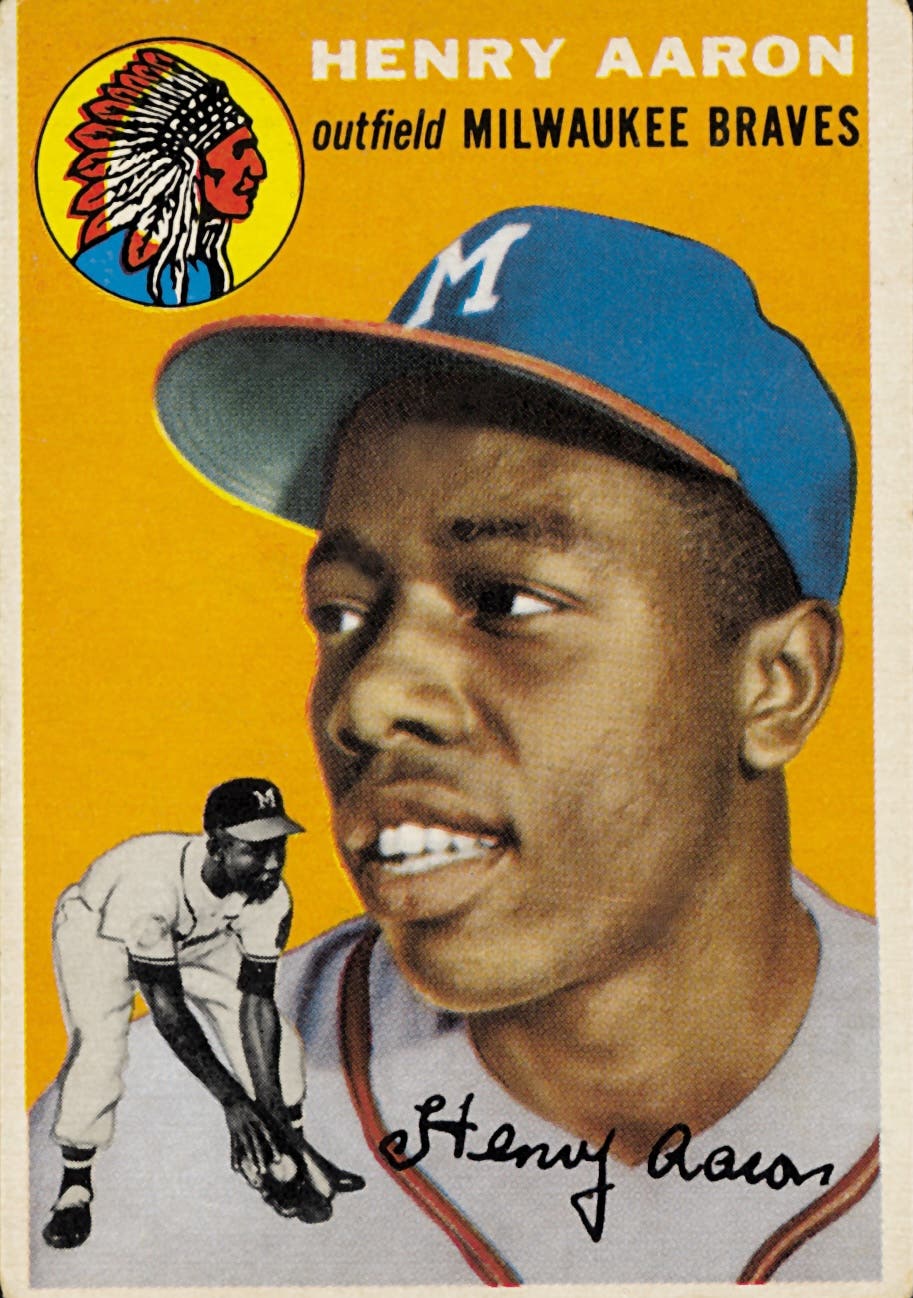
The price changes for 1960s Topps sets were similar to those for 1950s Topps sets with a few exceptions. The 1981-85 era reflected greater increases for these cards. Set prices of a few hundred dollars may have been too good to resist and prices headed up 6 percent per year versus no increase for 1950s sets. In the next four years, prices increased 50 percent per year, which was phenomenal but actually more modest than the 60 percent increases for ’50s sets.
Over the 31 years, the 1960s sets increased 8.8 percent per year. This is only 1 percent per year less than 1950s sets but 1 percent per year compounded over 31 years is a significant financial difference. You wind up with about 25 percent less of a nest egg after 31 years with the 1 percent difference in annual returns.
1970s Topps sets
Sets from this era showed greater initial increases (21 percent) than the 1950s and ’60s sets, more modest gains (28 percent) in the 1985-89 era, bigger drops in value during the 1990s and modest overall annualized gains (6.8 percent) since 1981.
In the case of 1970s sets, all the gains were early on with set prices today generally below 1992 prices.
Bowmans
I looked at the 1948-55 Bowman sets as a group. Bowman card prices behaved similarly to the 1950s Topps prices but with more modest overall gains. Bowman values increased 7.9 percent per year for the 31 years versus 9.7 percent for Topps cards.
Bowmans were flat in the 1981-85 era, up 51 percent from 1985-89, up 15 percent per year until 1992, and virtually flat ever since with two exceptions. The 1949 Bowmans and the 1953 color sets escalated nicely.
Early gum cards
I looked at prices for 1933-35 Goudeys and 1939-41 Play Balls. Their performance was similar to the 1950s Topps, with annual increases averaging 9.8 percent. Increases were 4.5 percent from 1981-85, 50.1 percent from 1985-89, 20 percent from 1989-92, negative 1 percent from 1992-2001 and 5.2 percent thereafter.
Tobacco cards
Tobacco card prices were harder to quantify. You don’t buy tobacco sets very often. The Wagner card itself throws around considerable weight, if invited into the number party. I decided to look at the prices of common cards from popular sets.
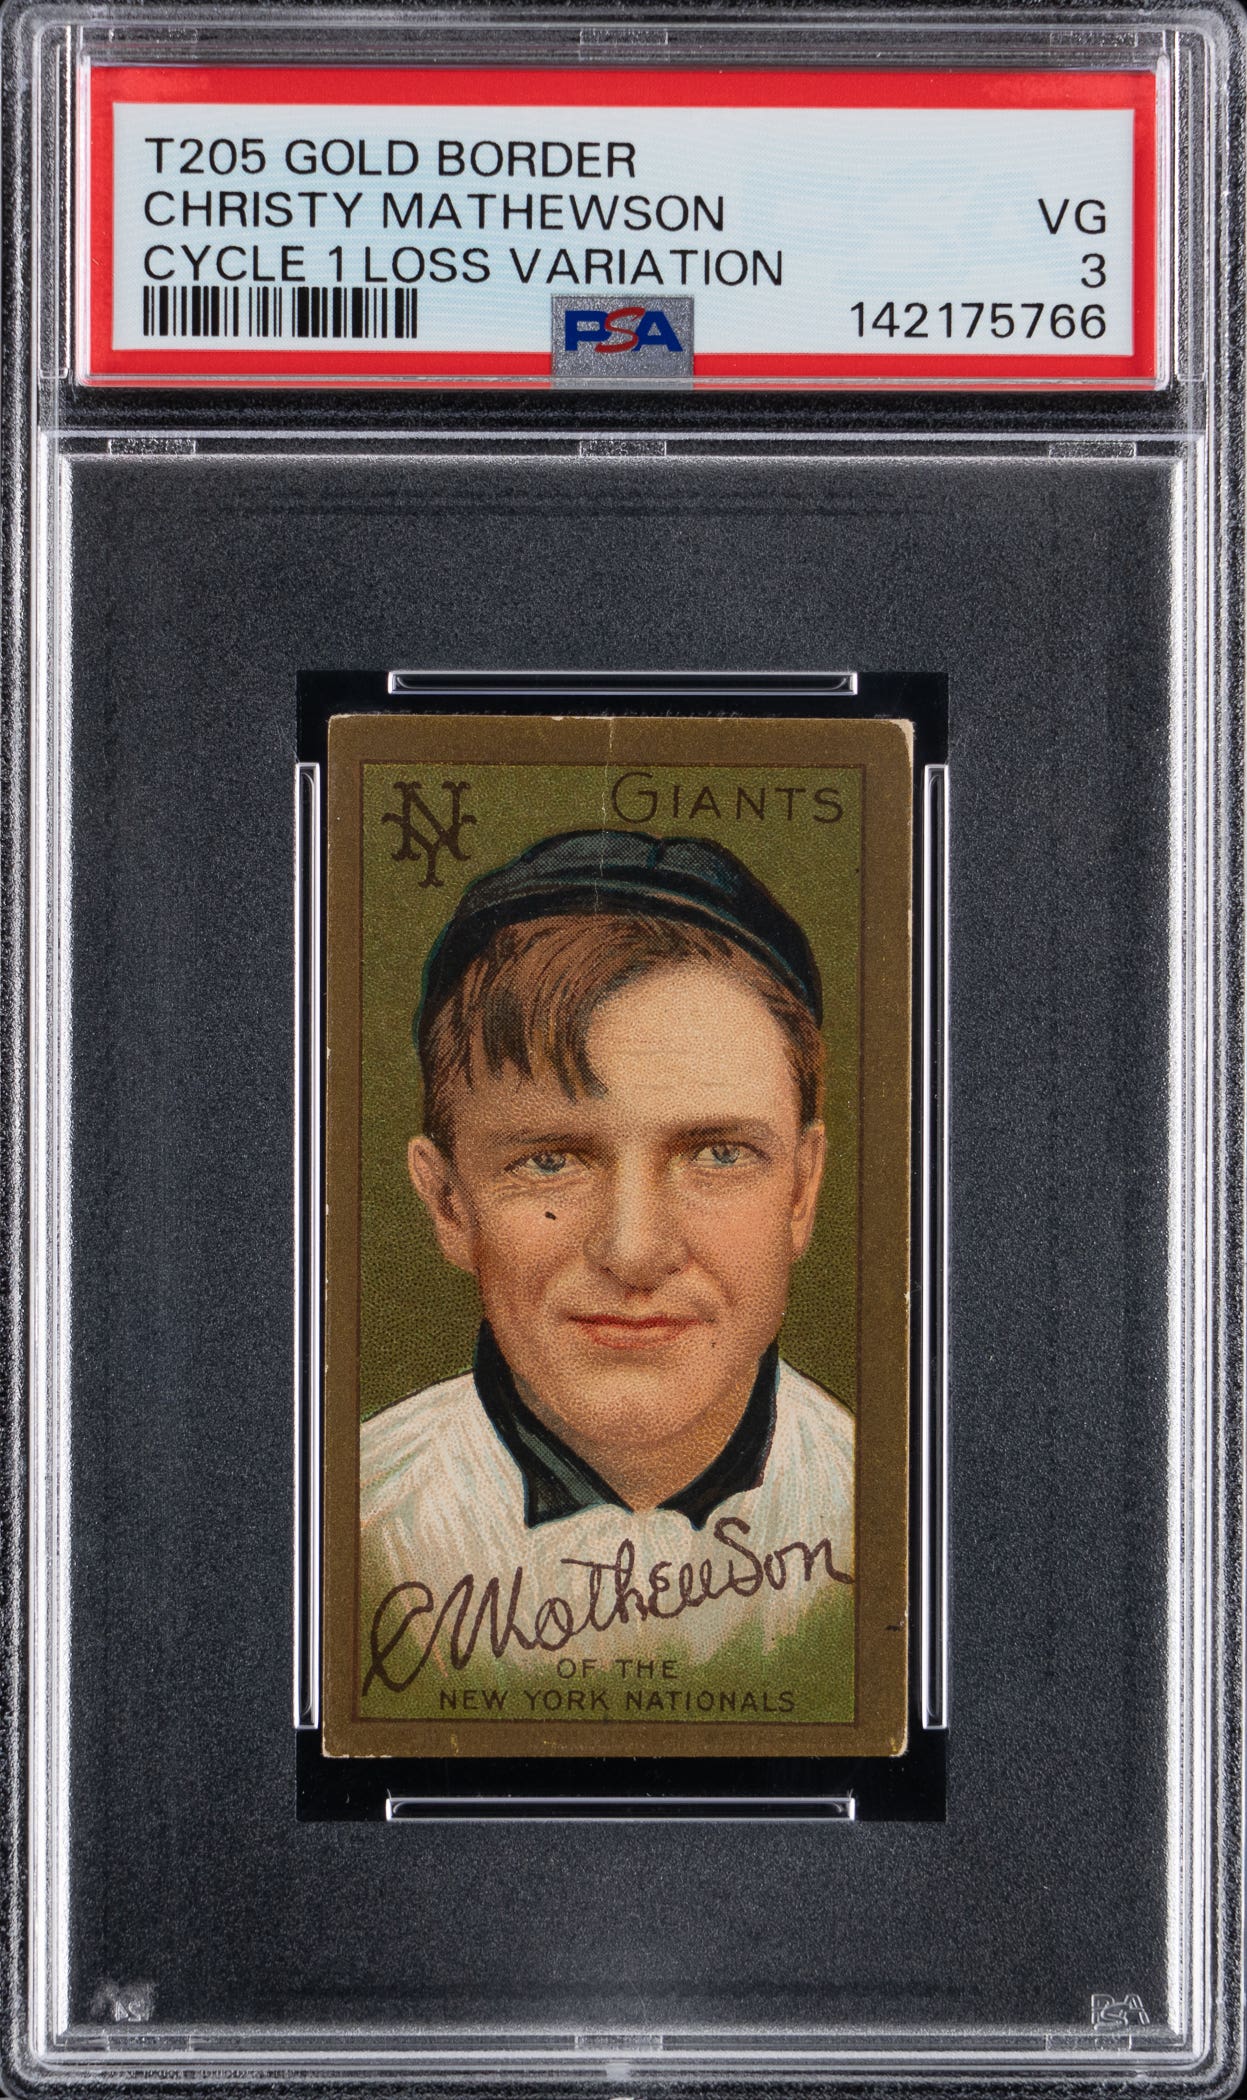
Mint tobacco cards have shown significant price increases. I just don’t know if there is such a thing as a Mint card that is more than 100 years old. I used the Excellent prices as a better indicator of what might be collected at the high end. I looked at prices for commons from the T202, T205, T206 and T207 sets.
The tobacco cards fared better than any of my other groups with a 10.7 percent return per year for the 31 years. The annual returns were 12 percent from 1981-85, 27 percent from 1985-89, 18 percent from 1989-92, 2 percent in the bleak 1991-2001 era and 11 percent per year since 2001.
I took a look at the numbers. If you assumed a 50 percent cost to sell instead of my 10 percent, instead of getting a 10.7 percent return you get a 9 percent return over the 31 years. Certainly not bad, but this also assumes you had a nice pile of Excellent condition tobacco cards, didn’t sell any and didn’t put them in your bike spokes. If you jumped into tobacco cards in, say, 1991 and sold them with a 50 percent commission in 2012, the theoretical annual returns would have been a more modest 5 percent for the 21 years.
The VVCI returns
I took the above sea of numbers and treated each set as if it were of equal value to other sets. (A big assumption, but since I write the article, I get to compute the index.) My logic was that tobacco cards and 1952 Topps sets would have too big an impact on the VVCI and not reflect the experience of an average vintage card collector. The annual returns for the all the vintage sets for various periods in the VVCI were as follows:
- 1981-85: 7.3 percent
- 1985-89: 45.2 percent
- 1989-1992: 17.2 percent
- 1992-2001: -2.0 percent
- 2001-12: 4.6 percent
From 1981-2012, the average annual return was 8.6 percent.
From 1992-2012, the average annual return was 1.2 percent.
Individual cards versus sets
Instead of mutual funds or the S&P 500, you can pick individual stocks and prove yourself smarter (or luckier) than the next investor. The same goes for baseball cards.
Let’s look at a few cards and compare their theoretical financial performances to the overall VVCI, which we all now completely understand and love.
I picked a few superstars, stars, rookies and commons to see who did better or worse in the fickle financial price guides than the VVCI. While I examined values since 1981 over various periods, I’m going to keep it simple and just look at the change in values since 1992.
The VVCI shows an annual return of 1.2 percent per year for this lackluster period. I checked a few cards of Ruth, Mantle, Williams, Musial and others to see how they performed. For commons, I just picked the first series unless otherwise noted.
Better than average:
- 1933 Goudey Babe Ruth: 5.9 percent
- 1972 Topps commons: 5.9 percent
- 1933 Goudey commons: 5.6 percent
- 1962 Topps commons: 4 percent
- 1959 Topps Mantle: 3.9 percent
- 1953 Topps Paige: 3.7 percent
- 1934 Goudey commons: 3.6 percent
- 1953 Topps Jackie Robinson: 2.6 percent
- 1958 Topps Ted Williams: 2.4 percent.
Worse than average:
- 1980 Topps Henderson: -5.1 percent
- 1949 Bowman high numbers: -2.6 percent
- 1977 Topps Carlton: -2.3 percent
- 1952 Topps commons: -1.2 percent
- 1958 Topps Musial: -0.2 percent
- 1959 Topps Mays: -0.2 percent.
Cards that were fairly close to the average return included 1952, 1953 and 1956 Topps Mantles, 1952 Bowman Mantle, 1952 Topps Mays, 1953 Bowman Musial, 1939 Play Ball Ted Williams, 1954 Topps Williams and 1955 Bowman commons. As a young collector, I thought the long-awaited 1953 Bowman Musial and the 1954 Topps Ted Williams cards would be gold mines in the future. It turns out they just stayed in there with the rest of the pack.
The above sample of cards did not try to identify the biggest winners and losers among all cards, just the ones I decided to examine. While I thought there might be some common theme to the results, I didn’t see one. Commons and stars jumped all over as to performance.
Surprisingly, 1972 Topps commons did better (theoretically) than a 1952 Topps Mantle. The 1972 Topps tripled from 50 cents to $1.50, while the 1952 Topps Mantle went from $24,000 to $36,000. Most people would have gone with the Mantle investment as being easier to carry around (and sell) than $24,000 worth of 1972 commons.
Ruth, Mantle, Paige and Topps cards looked like they did better than Mays, Musial and Bowmans. If you look at performance since 1981, the Rickey Henderson rookie didn’t do too badly despite going from $135 to $39 since 1992. However, you had to buy his rookie card at 30 cents when it was first issued. This type of experience drove many into chasing rookie cards and then proceeding cautiously once burned.
Summary
There are many complicated assumptions involved in trying to convert the collector’s exciting pursuit of baseball cards to the dry world of financial indices.
- Price guide values for baseball cards have reflected tremendous increases since 1981. However, price increases have been modest since 1992.
- One of the biggest unknowns is how much will it cost a collector to sell or how much of a discount will be given. My assumption of a 10 percent cost is wishful thinking.
- Generally, the older the card, the greater the percentage increase in value.
- The index compared prices for Mint cards, which have done better than prices for cards in lower conditions.
- Buying one stock has more risk than buying the market. There may be significantly more reward or loss. The same is true when buying individual players versus collecting all popular vintage sets.
Advice
Paraphrasing the humorist Dave Barry, if you carefully follow the financial advice I’ve described as to card collecting and the nuances of the Vrechek Vintage Card Index, I guarantee you will be the first person ever to do so.
Enjoy collecting whatever you like and let your heirs, successors and assigns worry about the numbers.
George Vrechek is a freelance contributor to Sports Collectors Digest and can be contacted at vrechek@ameritech.net.


